and Chasing
[Index][Archives]
Wall cloud - 9th March 2000
by Jimmy Deguara
| Storm News and Chasing [Index][Archives] |
Wall cloud - 9th March 2000 by Jimmy Deguara |
Not much was expected
in terms of storms unless the cloud band and rain cleared. But the night before,
I noticed that the rain band was indicating signs of clearing. Throughout the
morning, it was obvious that the developing cumulus would develop into storms.
But they were aligned along the mountains and moving from the northwest.
During the early
afternoon period, there were pulse cells developing and collapsing along relatively
thin bands. The tops were crisp though indicating stronger pulses. At about 3pm,
I had to make a decision: do I go with my friend for a cup of coffee (which I
had suggested) or do I just decline and and grab the camera. "Sorry. Going home",
I said. What bugged me is that I had tossed whether I should bring my camera or
not that morning. Due to the decision not to bring a camera, I had already missed
an opportunity of photographing a spectacular mamatus during the morning without
the stratocumulus. I wasn't going to make the same mistake again!
When I got nearer
to home, the larger cumulus began to weaken. So rather than go out again, I logged
onto the internet and kept watch. ASWA
member Mario and I discussed over ICQ what was happening. We checked and discussed
the latest AVN model for Lifted Index and wind profile. Well moisture was sufficient
with all the rain that had fallen during the week and even early that morning.
The surface lifted
index was sufficient for storms, even severe storms. The wind profile though was
excellent. We had a jet over eastern and northeastern New South Wales and nice
north to north-easterly winds in the lower layers providing some sort of backing.
Unfortunately for Sydney, a cloud band was moving south with the jet and therefore
cut off the heating source for thunderstorms. But it remained sunny over the region
of the storms and being in the right exit region of the jet made it ideal setup.
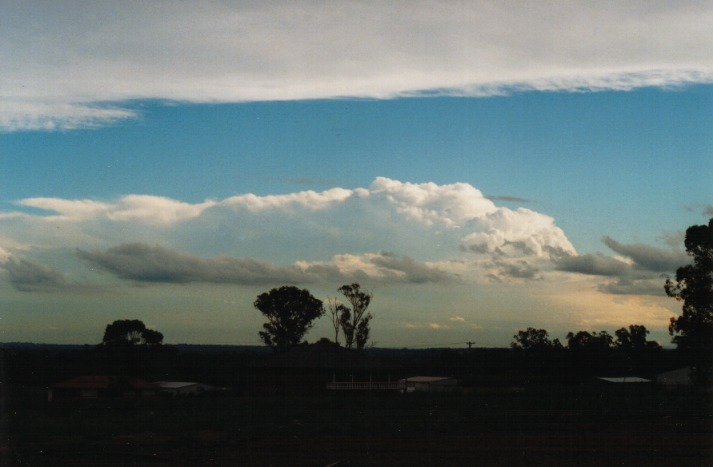
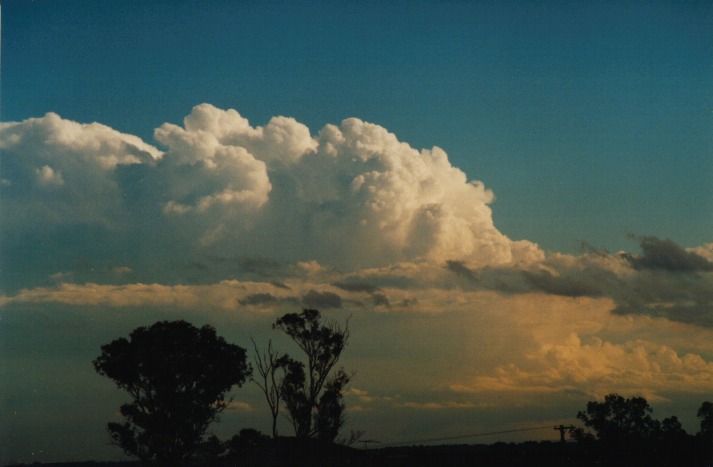
As evening approached,
the closest large cumulus near Penrith collapsed. It revealed an impressive back
shearing anvil from a cell that had gone severe. I took a couple of photographs
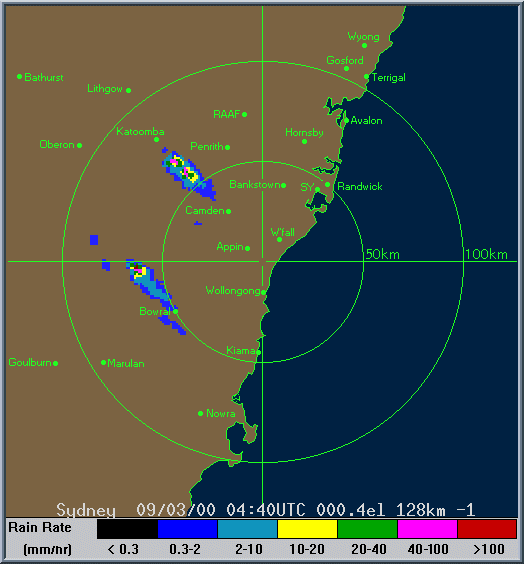
of it and discussed it with Mario. It was in the next radar scan that Mario suggested
"Red on the radar!!!" I reloaded and there it was. Taking into account that it
was lagging about ten minutes, it coincided with my photograph of the severe cell.
I suppose I had accidently overlooked the amount of high reflectivity of the next
scan but still it was signficant. It was at this point that the storm changed
direction at about 20 or so degrees to the left of the mean wind flow.
With this scan
showing red pixes on the radar, my adreanlin went out of control. But instead
of taking off in the car, I grabbed my "essential" equipment and crossed the road.
After a short time
photographing and video taping the storm, what came into view was unbelievable.
I tried to clear my eyes to see if I was seeing correctly. I moved a few metres
to make sure the tree wasn't in the way. It seemed that the lowering was a wall
cloud. But you guessed it: as I was filming, the video camera shut down. The tape
had run out!!! At this point I went crazy not knowing what to do. I seriously
wanted to chop my body in half allowing one part to get another tape and I would
stand there and watch to see what happened.
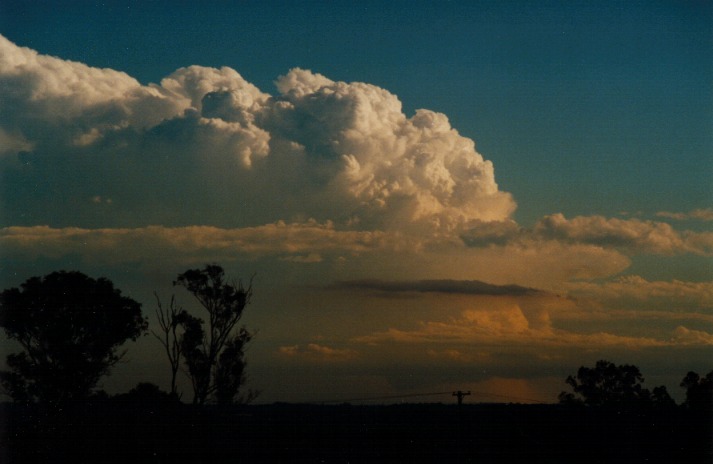
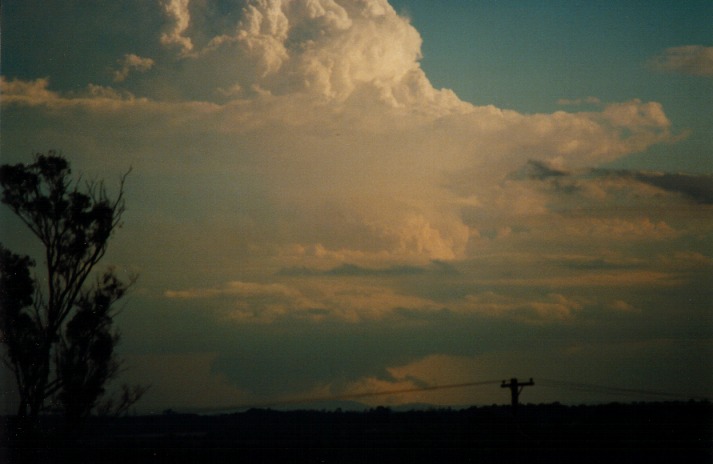
This wall cloud
and associated lowering lasted for at least 25 minutes or more and at one stage
had the lowering and scud almost touching the ground! But from about 6pm, the
storm began to lean further foward and weakened very rapidly. At this point, I
walked back home.
Radar indicates
that the red reflectivity was evident in six consecutive scans. In other words,
it lasted about an hour. It seems that the maximum reflectivity came from one
main cell which I had been observing for the whole period. This cell existed in
a very good shear environment, had strong updraughts and a base structure that
fed on the northerly airflow. The fact that the major cell within the storm was
long lasting and moved to the left of the mean wind flow indicated that it had
supercell characteristics.
I suspect that
the storm collapsed probably from insufficient heating with the sun setting and
perhaps blown apart by the jet. My belief was that there was just the right balance
of wind shear during the period from about 4:30pm to almost 6pm.
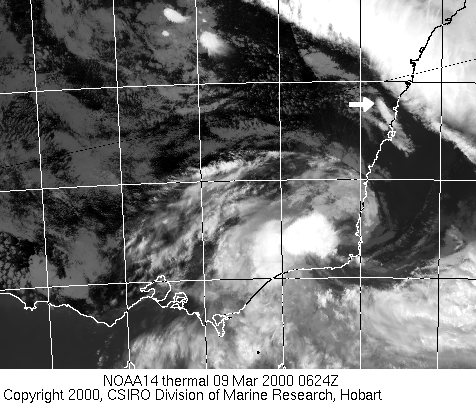
The arrow indicates
the storm referred to in this report.
This image obtained
from Bureau of Meteorology. 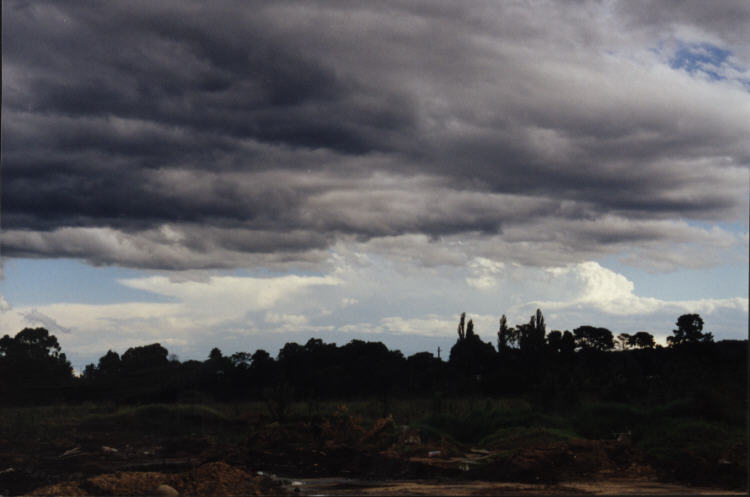
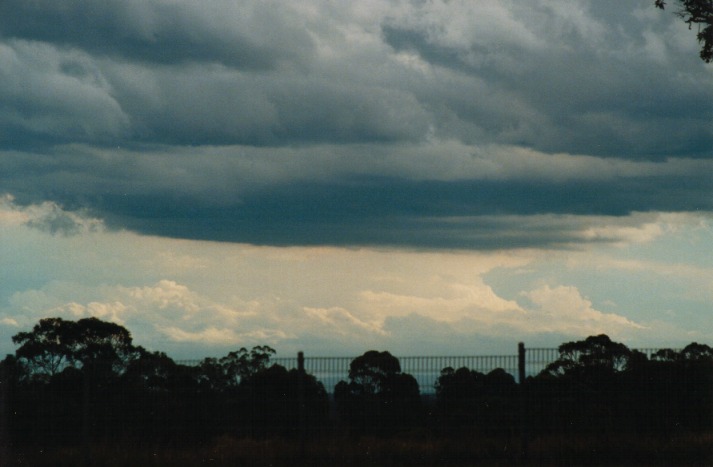
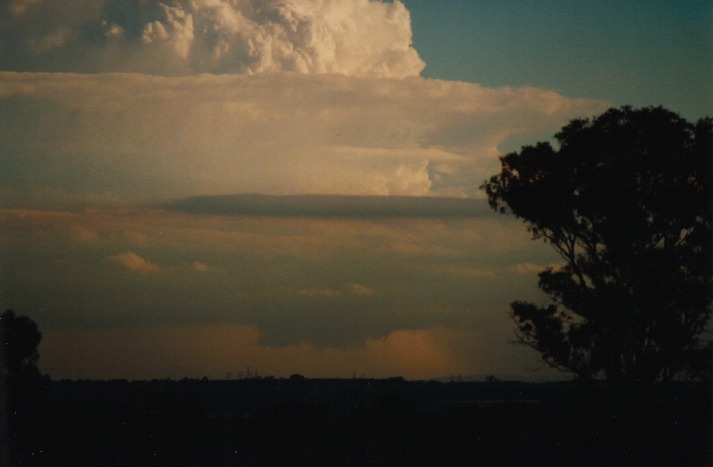
 That
morning, it was clearing with light west winds. Stratocumulus was widespread but
through the breaks I could see spectacular mamatus obviously part of the clearing
storms associated with the cloud band.
Times are local Daylight
Saving Time (UTC +11)
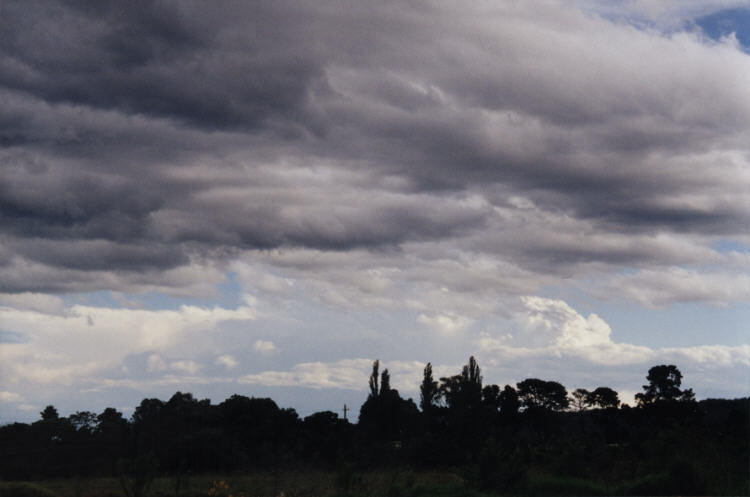
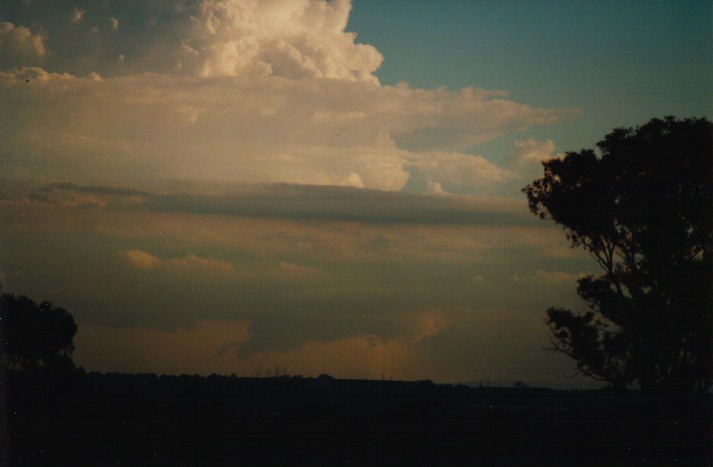
That
morning, it was clearing with light west winds. Stratocumulus was widespread but
through the breaks I could see spectacular mamatus obviously part of the clearing
storms associated with the cloud band.
Times are local Daylight
Saving Time (UTC +11)
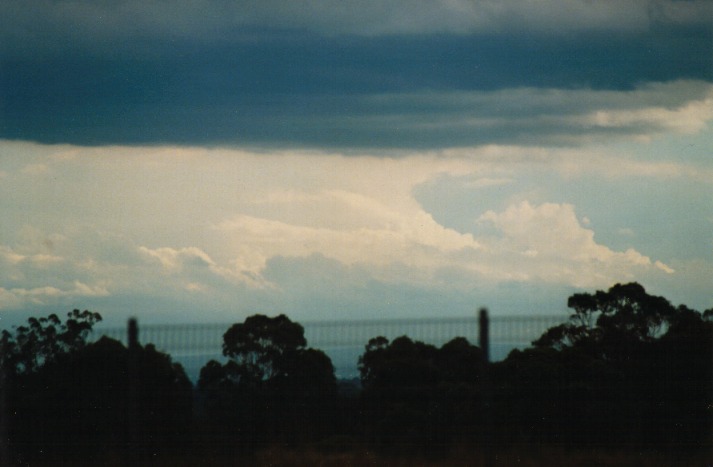
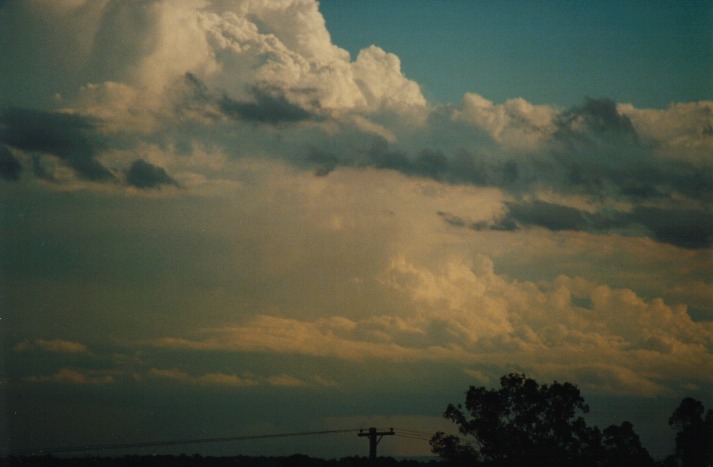
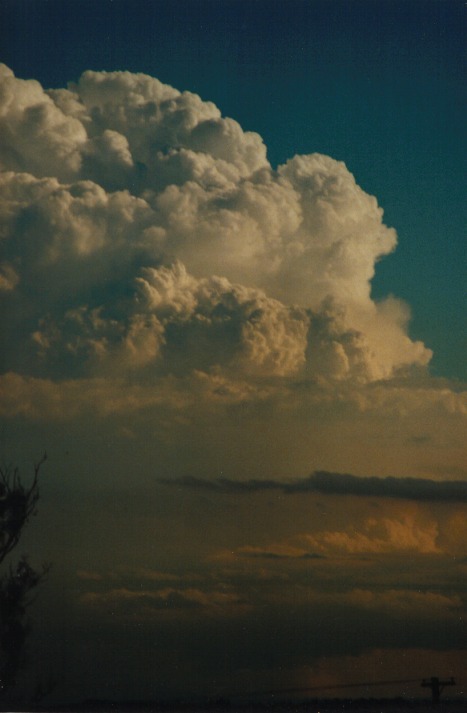
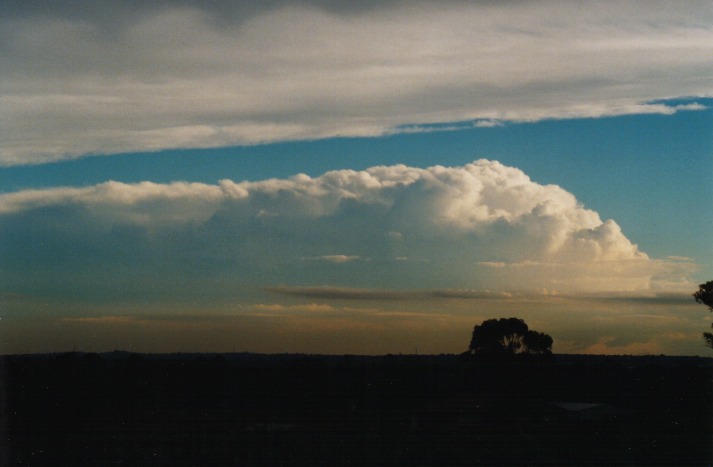
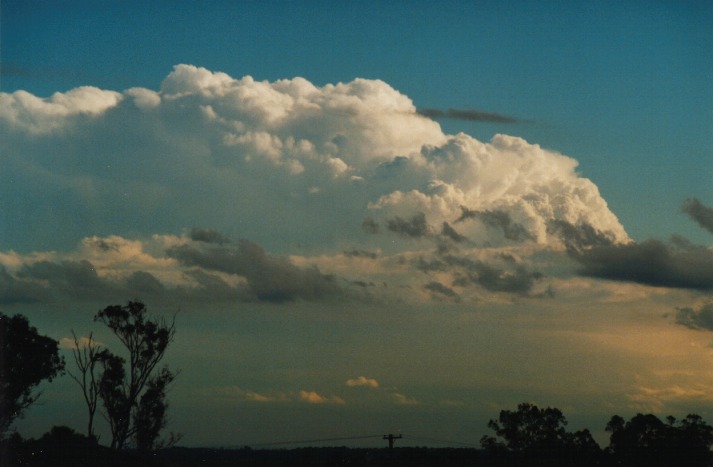 The
storm looked quite impressive particularly on the back end with excellent shear
conditions. The anvil faced southeast. There were strong updraughts rising in
the same respective area of the storm.
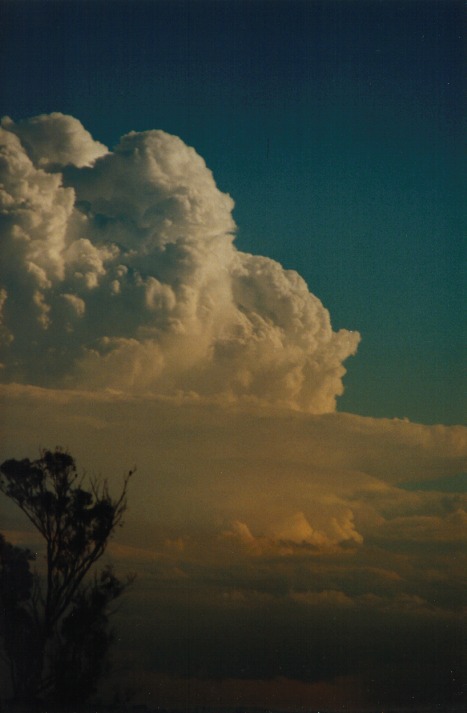
It was inevitable:
I needed a tape. I ran like a rocket to get that tape and left the neighbours
in charge of my equipment whilst I rushed inside. Within five minutes I was setup
again. But this time, (and perhaps just as well), I moved further to find a gap
between trees (that were situated 200 metres away) so that I could get a better
view of the base structure.
The
storm looked quite impressive particularly on the back end with excellent shear
conditions. The anvil faced southeast. There were strong updraughts rising in
the same respective area of the storm.
It was inevitable:
I needed a tape. I ran like a rocket to get that tape and left the neighbours
in charge of my equipment whilst I rushed inside. Within five minutes I was setup
again. But this time, (and perhaps just as well), I moved further to find a gap
between trees (that were situated 200 metres away) so that I could get a better
view of the base structure.
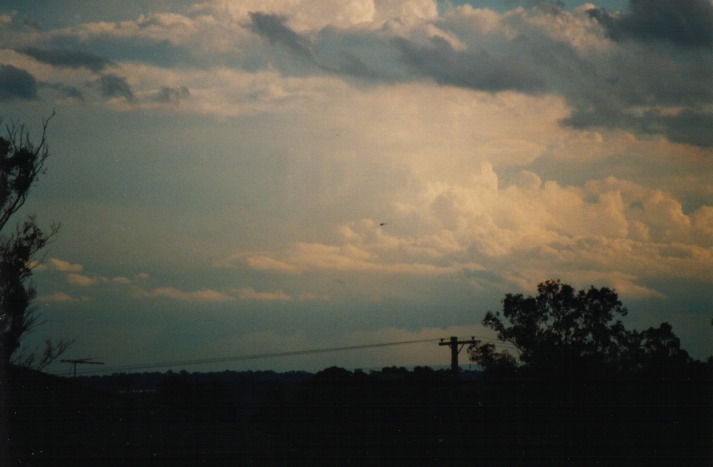
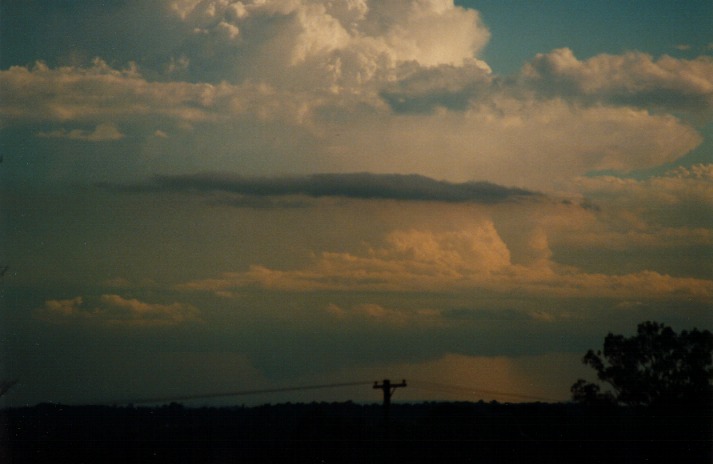
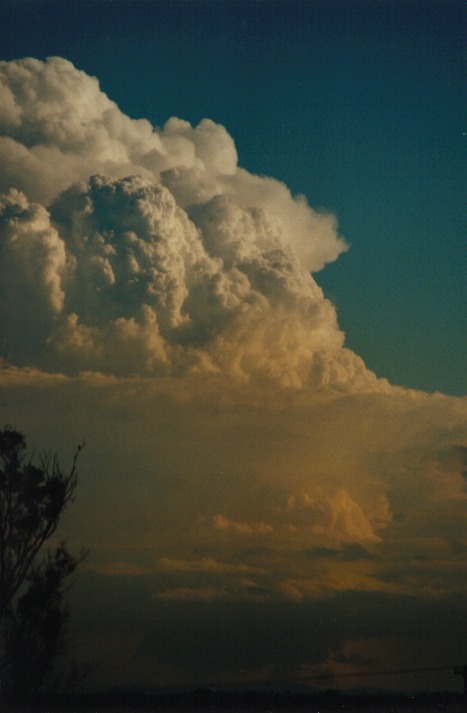
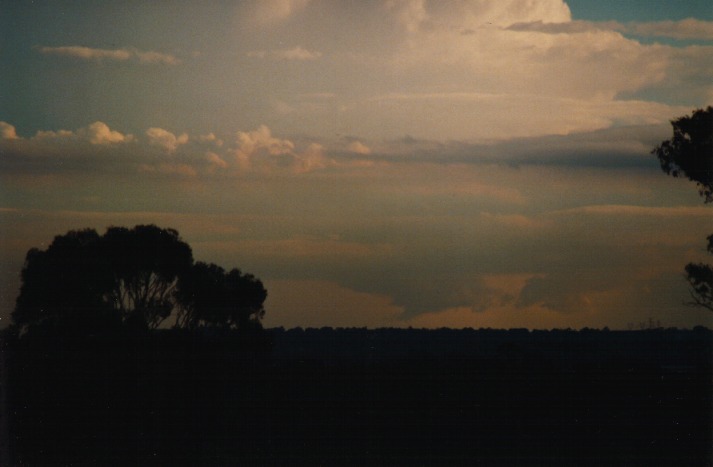
 The storm was moving
reasonably quickly. As I watched, the lowering took more of a familiar shape of
a wall cloud. At this point I rang Paul Graham to alert him of the situation,
so that he could alert the aussie-weather mailing list and also to make sure a
severe weather warning or advice was out. Paul confirmed it a few minutes later.
The storm was moving
reasonably quickly. As I watched, the lowering took more of a familiar shape of
a wall cloud. At this point I rang Paul Graham to alert him of the situation,
so that he could alert the aussie-weather mailing list and also to make sure a
severe weather warning or advice was out. Paul confirmed it a few minutes later.
Radar
These images from
Bureau of Meteorology
Satellite Images
This image from CSIRO
Marine Division
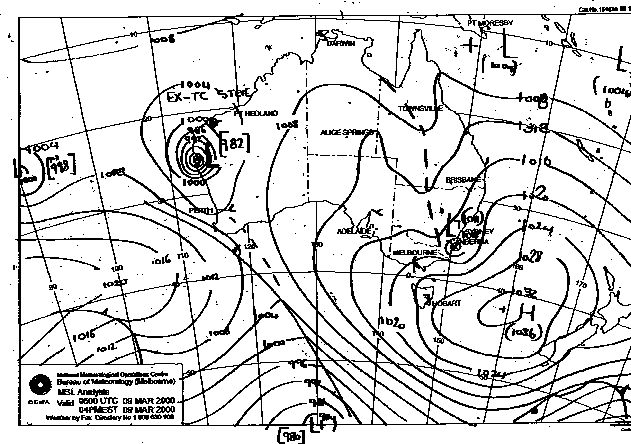
MSL Analysis Charts
5pm local 1st January 2000
AVN Charts for
06Z - NOAA Air Resources Laboratory
The following charts
represent model analysis for winds at the levels indicated.
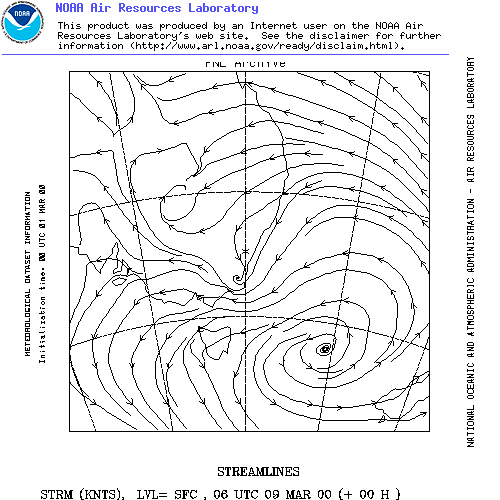
Winds at Surface
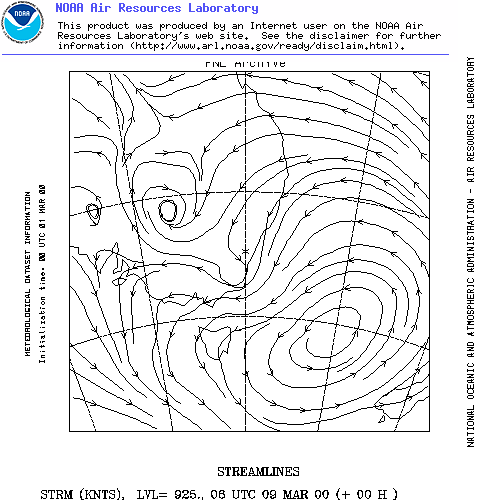
Winds at 925hPa
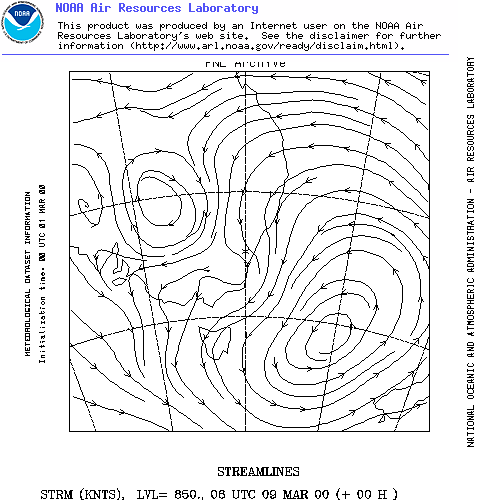
Winds at 850hPa
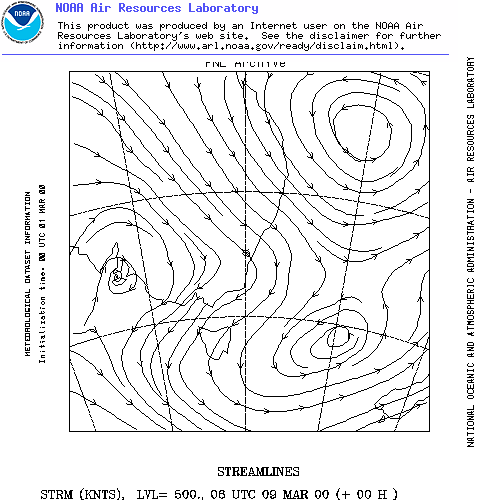
Winds at 500hPa
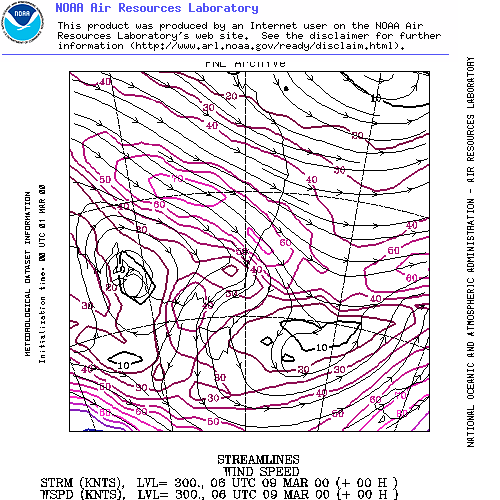
Winds at 300hPa and wind speed. Note the local windstream maximum jet which matches
with this storm on the satellite picture.
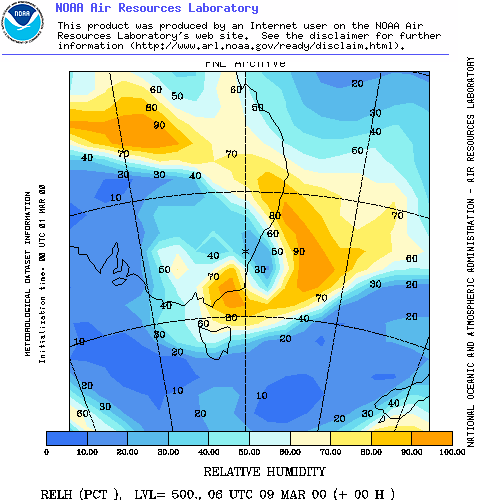
Relative Humidity at 500hPa level - dry air aloft in the middle layers
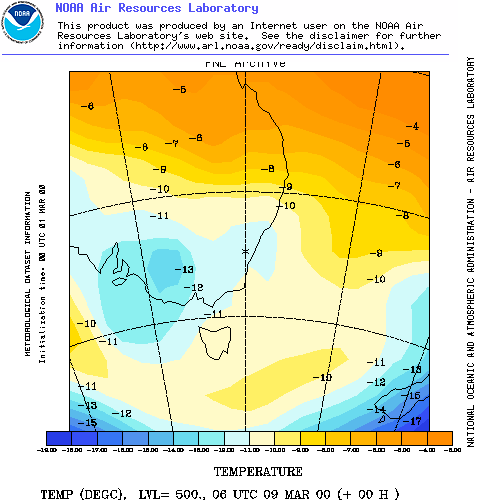
Temperature at 500hPa level - cold air in the middle layers
Document: 0003-01.html
Updated: 7th December, 2002
[Australian Severe Weather index]
[Copyright Notice]
[Email Contacts]
[Search This Site]