 Markers:
Show
Hide
Markers:
Show
Hide
Mouse-over the markers to view the TC name, click the marker to load the individual map.
| Tropical Cyclones
[Index] | Australian Region Tropical Cyclone Season 1998-1999 | ||
| Season 1998-1999 Summaries: [BoM-AU] [JTWC-AU] [JTWC-SIO] [JTWC-SPAC] [JTWC-SH] | |||
|
Mouse-over the markers to view the TC name, click the marker to load the individual map.
Markers:
Show
Hide
|
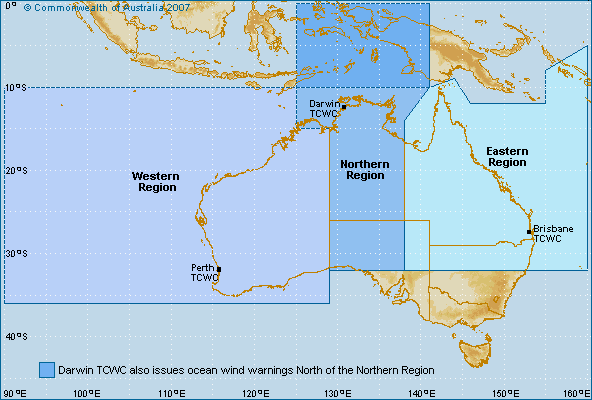
Bureau of Meteorology (BoM) Tropical Cyclone Data
Generally includes all tropical cyclones if the track commenced or moved into the Australian warning areas (between 90 E and 160 E). |
| Cyclone Name | Map ID |
Cyclone Number |
Basin | Date Range (UTC) | Min CP |
Max Winds |
Tracking Map and data |
|---|---|---|---|---|---|---|---|
| ZELIA | 1 | 816 / 199899_01 | SIO | 07 Oct 1998 - 10 Oct 1998 | 990 | 40 | Tropical Cyclone ZELIA |
| ALISON | 2 | 817 / 199899_02 | SIO | 07 Nov 1998 - 13 Nov 1998 | 955 | 85 | Tropical Cyclone ALISON |
| THELMA | 3 | 818 / 199899_03 | both | 30 Nov 1998 - 15 Dec 1998 | 920 | 120 | Tropical Cyclone THELMA |
| BILLY | 4 | 819 / 199899_04 | SIO | 01 Dec 1998 - 06 Dec 1998 | 965 | 70 | Tropical Cyclone BILLY |
| CATHY | 5 | 820 / 199899_05 | SIO | 22 Dec 1998 - 28 Dec 1998 | 991 | 50 | Tropical Cyclone CATHY |
| OLINDA | 6 | 821 / 199899_06 | SPAC | 20 Jan 1999 - 21 Jan 1999 | 987 | 45 | Tropical Cyclone OLINDA |
| DAMIEN | 7 | 822 / 199899_07 | SIO | 21 Jan 1999 - 28 Jan 1999 | 950 | 85 | Tropical Cyclone DAMIEN |
| PETE | 8 | 823 / 199899_08 | SPAC | 21 Jan 1999 - 23 Jan 1999 | 985 | 50 | Tropical Cyclone PETE |
| RONA | 9 | 824 / 199899_09 | SPAC | 09 Feb 1999 - 12 Feb 1999 | 970 | 75 | Tropical Cyclone RONA |
| VANCE | 10 | 825 / 199899_10 | SIO | 14 Mar 1999 - 23 Mar 1999 | 910 | 120 | Tropical Cyclone VANCE |
| ELAINE | 11 | 826 / 199899_11 | SIO | 15 Mar 1999 - 20 Mar 1999 | 945 | 90 | Tropical Cyclone ELAINE |
| FREDERIC | 12 | 827 / 199899_12 | SIO | 25 Mar 1999 - 01 Apr 1999 | 920 | 110 | Tropical Cyclone FREDERIC |
| GWENDA | 13 | 828 / 199899_13 | SIO | 02 Apr 1999 - 08 Apr 1999 | 900 | 120 | Tropical Cyclone GWENDA |
| HAMISH | 14 | 829 / 199899_14 | SIO | 19 Apr 1999 - 21 Apr 1999 | 980 | 55 | Tropical Cyclone HAMISH |
Minimum central pressure (CP) in hPa. Maximum winds are 10-min average in knots.
Tropical cyclone tracks developed by Michael Bath using data from the Bureau of Meteorology and Google Maps.
|
Document: bom_1998_1999_australian_region_tropical_cyclones.htm
Updated: 6 February 2026 [Australian Severe Weather index] [Copyright Notice] [Email Contacts] [Search This Site] [Privacy Policy] |