 Markers:
Show
Hide
Markers:
Show
Hide
Mouse-over the markers to view the TC name, click the marker to load the individual map.
| Tropical Cyclones
[Index] | Australian Region Tropical Cyclone Season 1999-2000 | ||
| Season 1999-2000 Summaries: [BoM-AU] [JTWC-AU] [JTWC-SIO] [JTWC-SPAC] [JTWC-SH] | |||
|
Mouse-over the markers to view the TC name, click the marker to load the individual map.
Markers:
Show
Hide
|
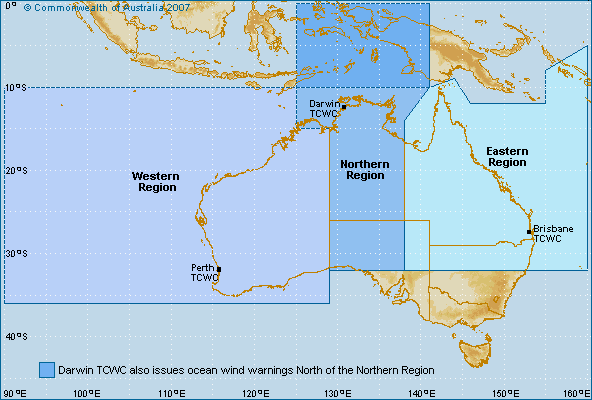
Bureau of Meteorology (BoM) Tropical Cyclone Data
Generally includes all tropical cyclones if the track commenced or moved into the Australian warning areas (between 90 E and 160 E). |
| Cyclone Name | Map ID |
Cyclone Number |
Basin | Date Range (UTC) | Min CP |
Max Winds |
Tracking Map and data |
|---|---|---|---|---|---|---|---|
| ILSA | 1 | 830 / 199900_01 | SIO | 08 Dec 1999 - 17 Dec 1999 | 980 | 55 | Tropical Cyclone ILSA |
| JOHN | 2 | 831 / 199900_02 | SIO | 09 Dec 1999 - 16 Dec 1999 | 915 | 110 | Tropical Cyclone JOHN |
| KIRRILY | 3 | 832 / 199900_03 | SIO | 24 Jan 2000 - 01 Feb 2000 | 975 | 75 | Tropical Cyclone KIRRILY |
| LEON | 4 | 833 / 199900_04 | SIO | 01 Feb 2000 - 08 Feb 2000 | 960 | 75 | Tropical Cyclone LEON |
| MARCIA | 5 | 834 / 199900_05 | SIO | 14 Feb 2000 - 18 Feb 2000 | 995 | 35 | Tropical Cyclone MARCIA |
| STEVE | 6 | 835 / 199900_06 | both | 25 Feb 2000 - 11 Mar 2000 | 975 | 60 | Tropical Cyclone STEVE |
| NORMAN | 7 | 836 / 199900_07 | SIO | 28 Feb 2000 - 10 Mar 2000 | 930 | 110 | Tropical Cyclone NORMAN |
| OLGA | 8 | 837 / 199900_08 | SIO | 15 Mar 2000 - 20 Mar 2000 | 985 | 50 | Tropical Cyclone OLGA |
| TESSI | 9 | 838 / 199900_09 | SPAC | 31 Mar 2000 - 03 Apr 2000 | 980 | 70 | Tropical Cyclone TESSI |
| VAUGHAN | 10 | 839 / 199900_10 | SPAC | 03 Apr 2000 - 07 Apr 2000 | 975 | 60 | Tropical Cyclone VAUGHAN |
| PAUL | 11 | 840 / 199900_11 | SIO | 10 Apr 2000 - 20 Apr 2000 | 915 | 120 | Tropical Cyclone PAUL |
| ROSITA | 12 | 841 / 199900_12 | SIO | 14 Apr 2000 - 20 Apr 2000 | 930 | 120 | Tropical Cyclone ROSITA |
| HUDAH | 13 | 842 / 199900_13 | SIO | 24 Mar 2000 - 09 Apr 2000 | 905 | 50 | Tropical Cyclone HUDAH |
Minimum central pressure (CP) in hPa. Maximum winds are 10-min average in knots.
Tropical cyclone tracks developed by Michael Bath using data from the Bureau of Meteorology and Google Maps.
|
Document: bom_1999_2000_australian_region_tropical_cyclones.htm
Updated: 6 February 2026 [Australian Severe Weather index] [Copyright Notice] [Email Contacts] [Search This Site] [Privacy Policy] |